Quipu Analysis in Inca Peru

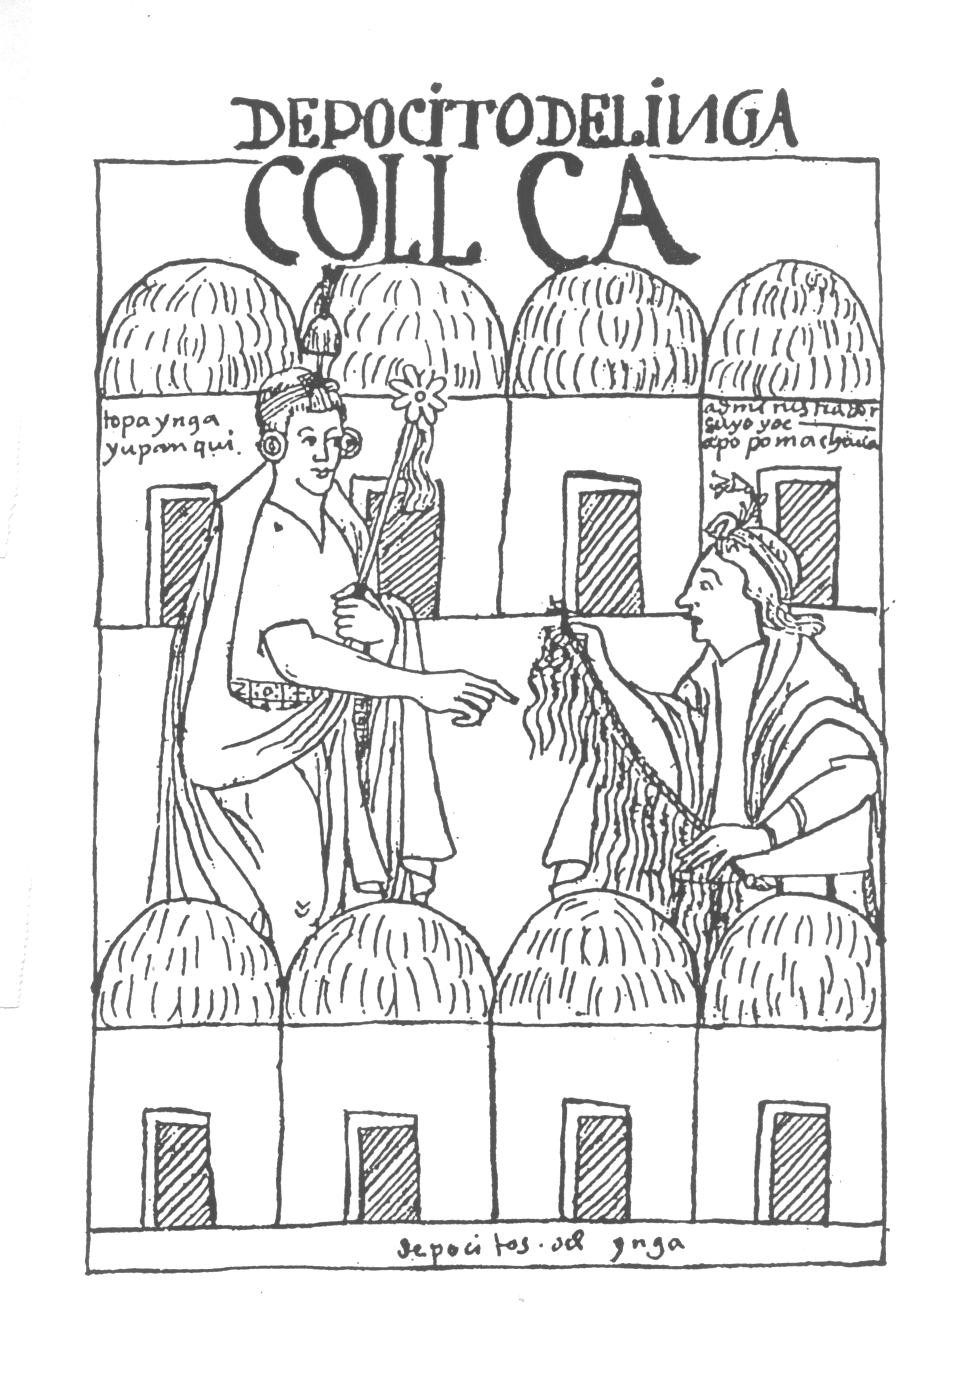
One of the oldest records of extensive information storage and handling is from the Inca reign in Peru. The figure shows an extract from a book (Nueva Coronica y Buen Gobierno) written and illustrated in 1615 by Guaman Poma de Ayala, the son of a Spanish conquistador and an Inca princess. Poma de Ayala has recorded in a pictorial way many of the customs of the Inca period. The latter was characterized by a highly hierarchical and bureaucratic government. Money was not used for exchange of goods and services. Gold, of which there was plenty, had only a decorative and religious function.
As a result, elaborate and complex record keeping was required to account for food, clothing, shelter and other goods distributed to the inhabitants, on the one hand, and work performed by the recipients on fields, in various construction projects and in the civil and military service, on the other hand. Needless to say, these records were of a highly multivariate nature, as they described practically all the needs and activities of that period.
As written language was lacking, the Incas had invented a recording system by means of knots in colored ropes, which is referred to as Quipu. (It seems to be still in use in some parts of Peru.)
The Quipu system required highly trained and erudite recorders and readers, somewhat equivalent to the statisticians of today. The Quipu keepers were in high esteem in the Inca hierarchy, as they were often recruited (more or less as hostages) among the children of the rulers of occupied territories.
On the left side of the figure we see the "Chief Executive Officer", Inca Yupanqui, requesting information about the contents of the national store rooms (Depocitos del Inca) from his statistician, who is represented on the right side with Quipu in hands. The figure suggests that statisticians in Inca time were recognizable by the flower they wore in their hair. (The habit may have carried over to San Francisco in the nineteensixties.) Notice that the Inca seems to be satisfied with the way his business is administrated, quite different from the impression of frustration of contemporary management that is conveyed by the previous figure. The difference is due to the availability of methods and instruments to obtain useful information from the many data that describe the multiple facets (or variables) of the world we live in. This is precisely the aim of Multivariate Data Analysis.
The most common instruments for analyzing data are either of the Quipu type, such as bar charts and pie charts that represent one variable at a time, or geometrical diagrams that are capable of showing relationships between two or three variables. The invention of the diagram is attributed to René Descartes who in 1637 made use of it in an appendix (La Géometrie) of his famous "Discours de la Méthode pour bien conduire sa Raison et chercher la Vérité dans les Sciences" (An exposition of the method for the good conduct of reason and for the search of the truth in the sciences) where he laid down the foundation of analytical geometry. None of these tools for data analysis, however, can be considered as truly multivariate.